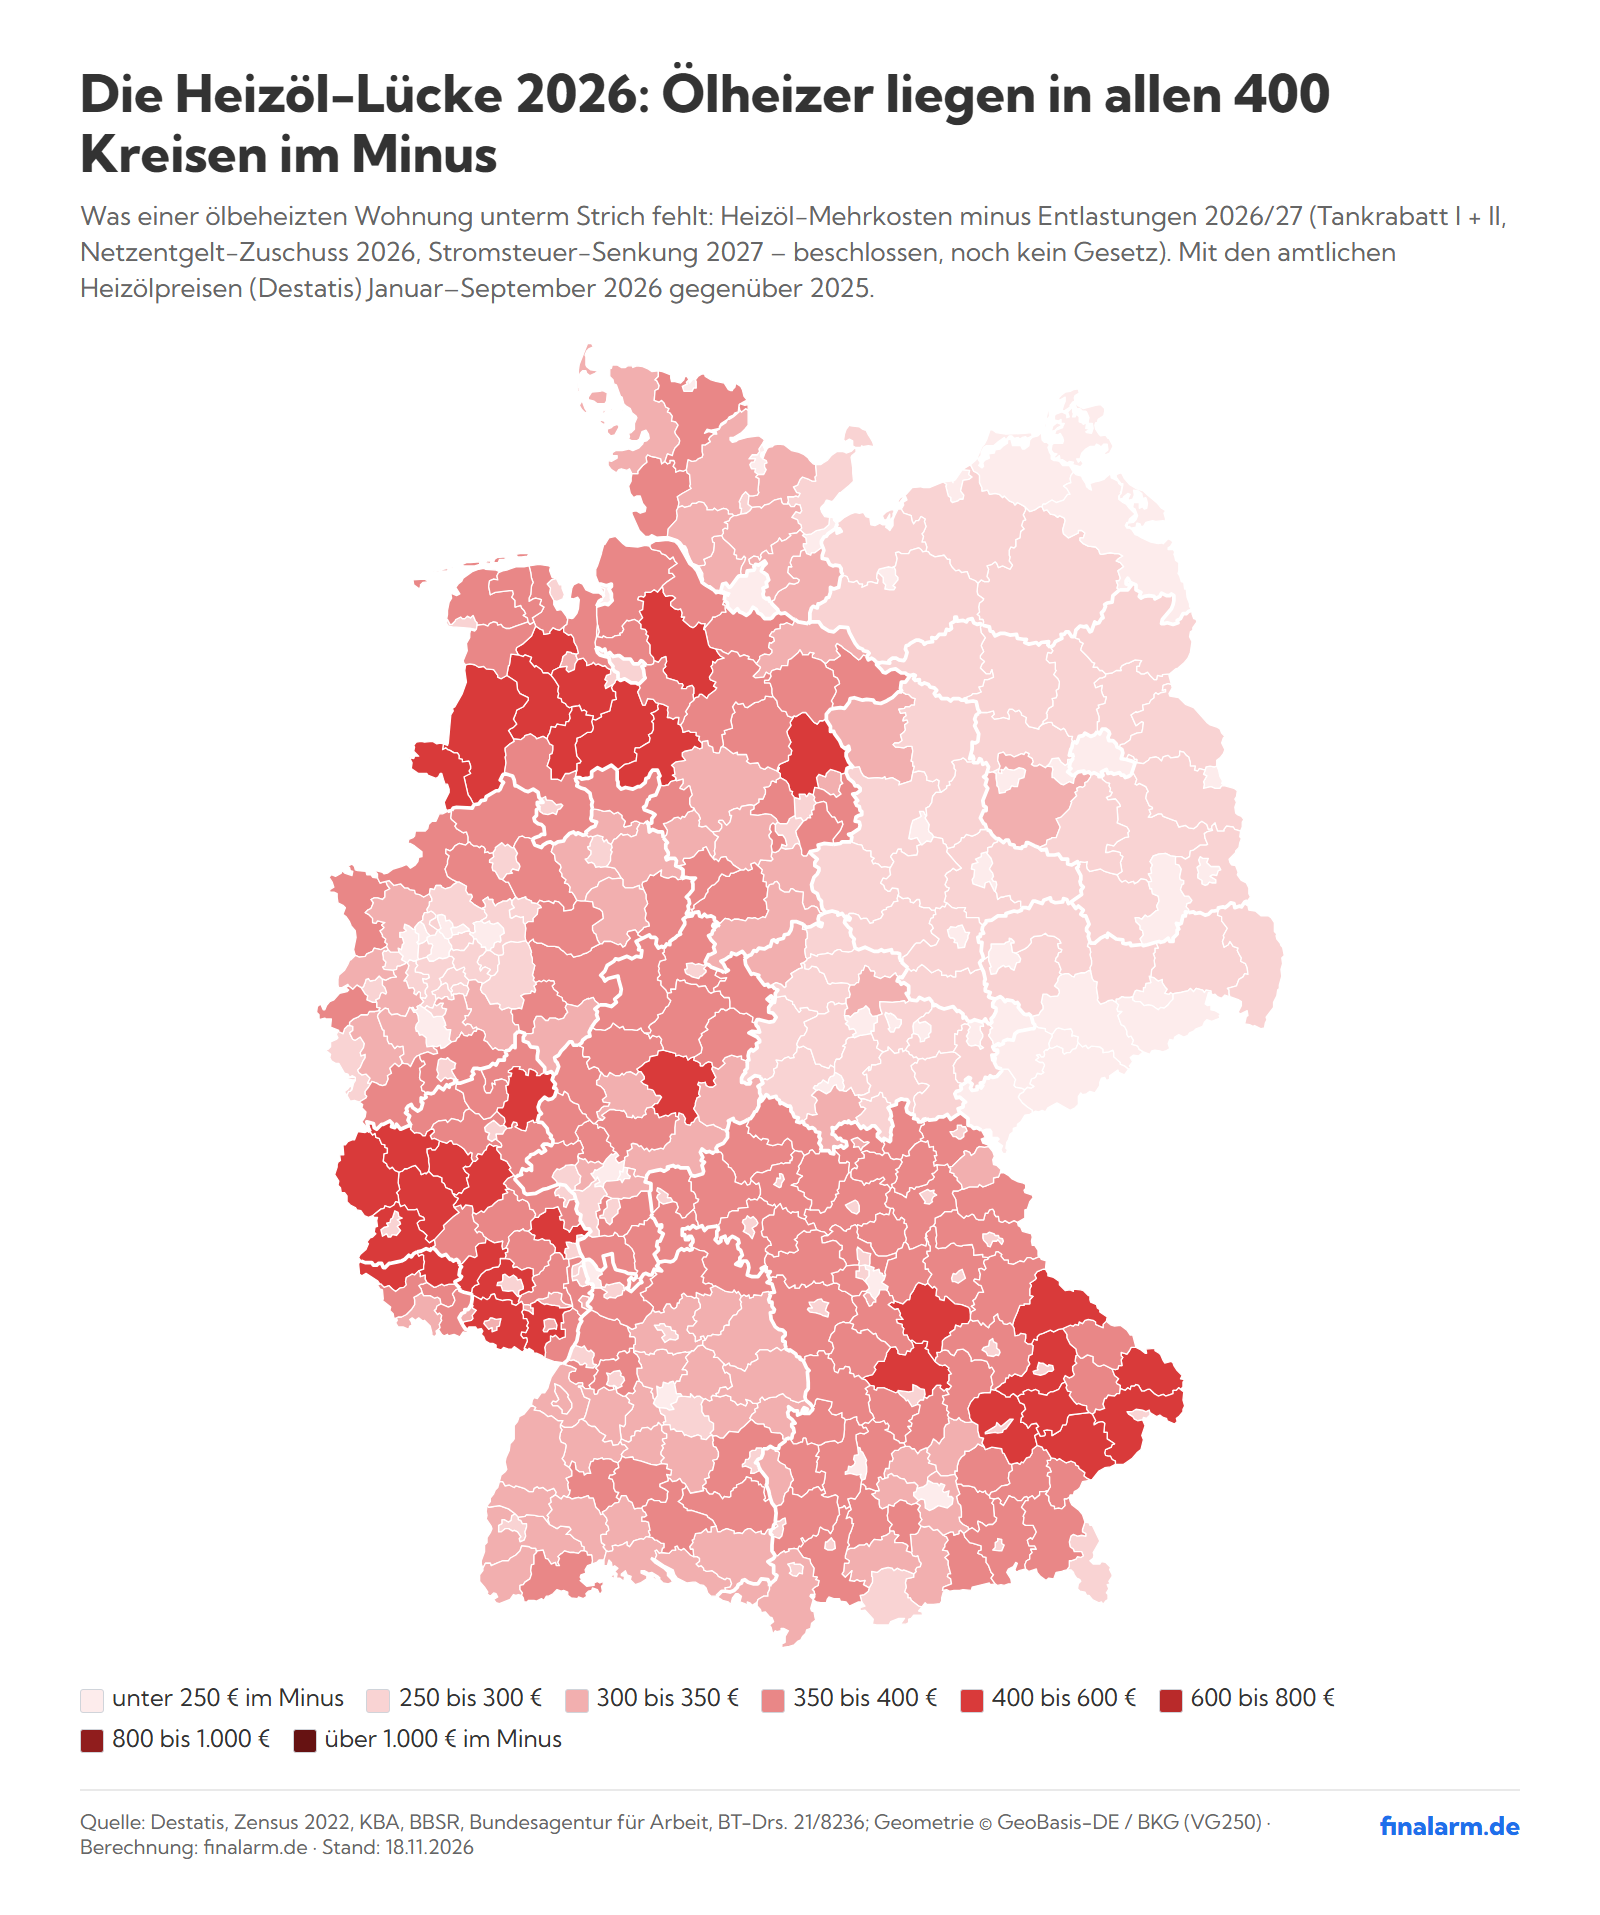

In this study:
- The sore point: Almost everyone gets relief, yet oil-heated homes are left around €330 a year short.
- The stress test: Even a family with two cars that heats with oil is worse off in every district.
- District check: Depending on the district, the oil-heating gap ranges from €198 to almost €465 a year.
- Hardship Index: Merzig-Wadern comes top, Rhineland-Palatinate has 8 of the top 20.
- Country versus city: Rural oil-heated homes are around €350 short, those in large cities just under €250.
- The cause: Heating oil rose more than six times as fast as energy overall, and the state profits too.
- The politics: Two fuel tax cuts, lower grid fees and a lower electricity tax, but no help aimed at heating oil.
- What could come next: If October prices hold, oil-heated homes are almost €950 a year short.
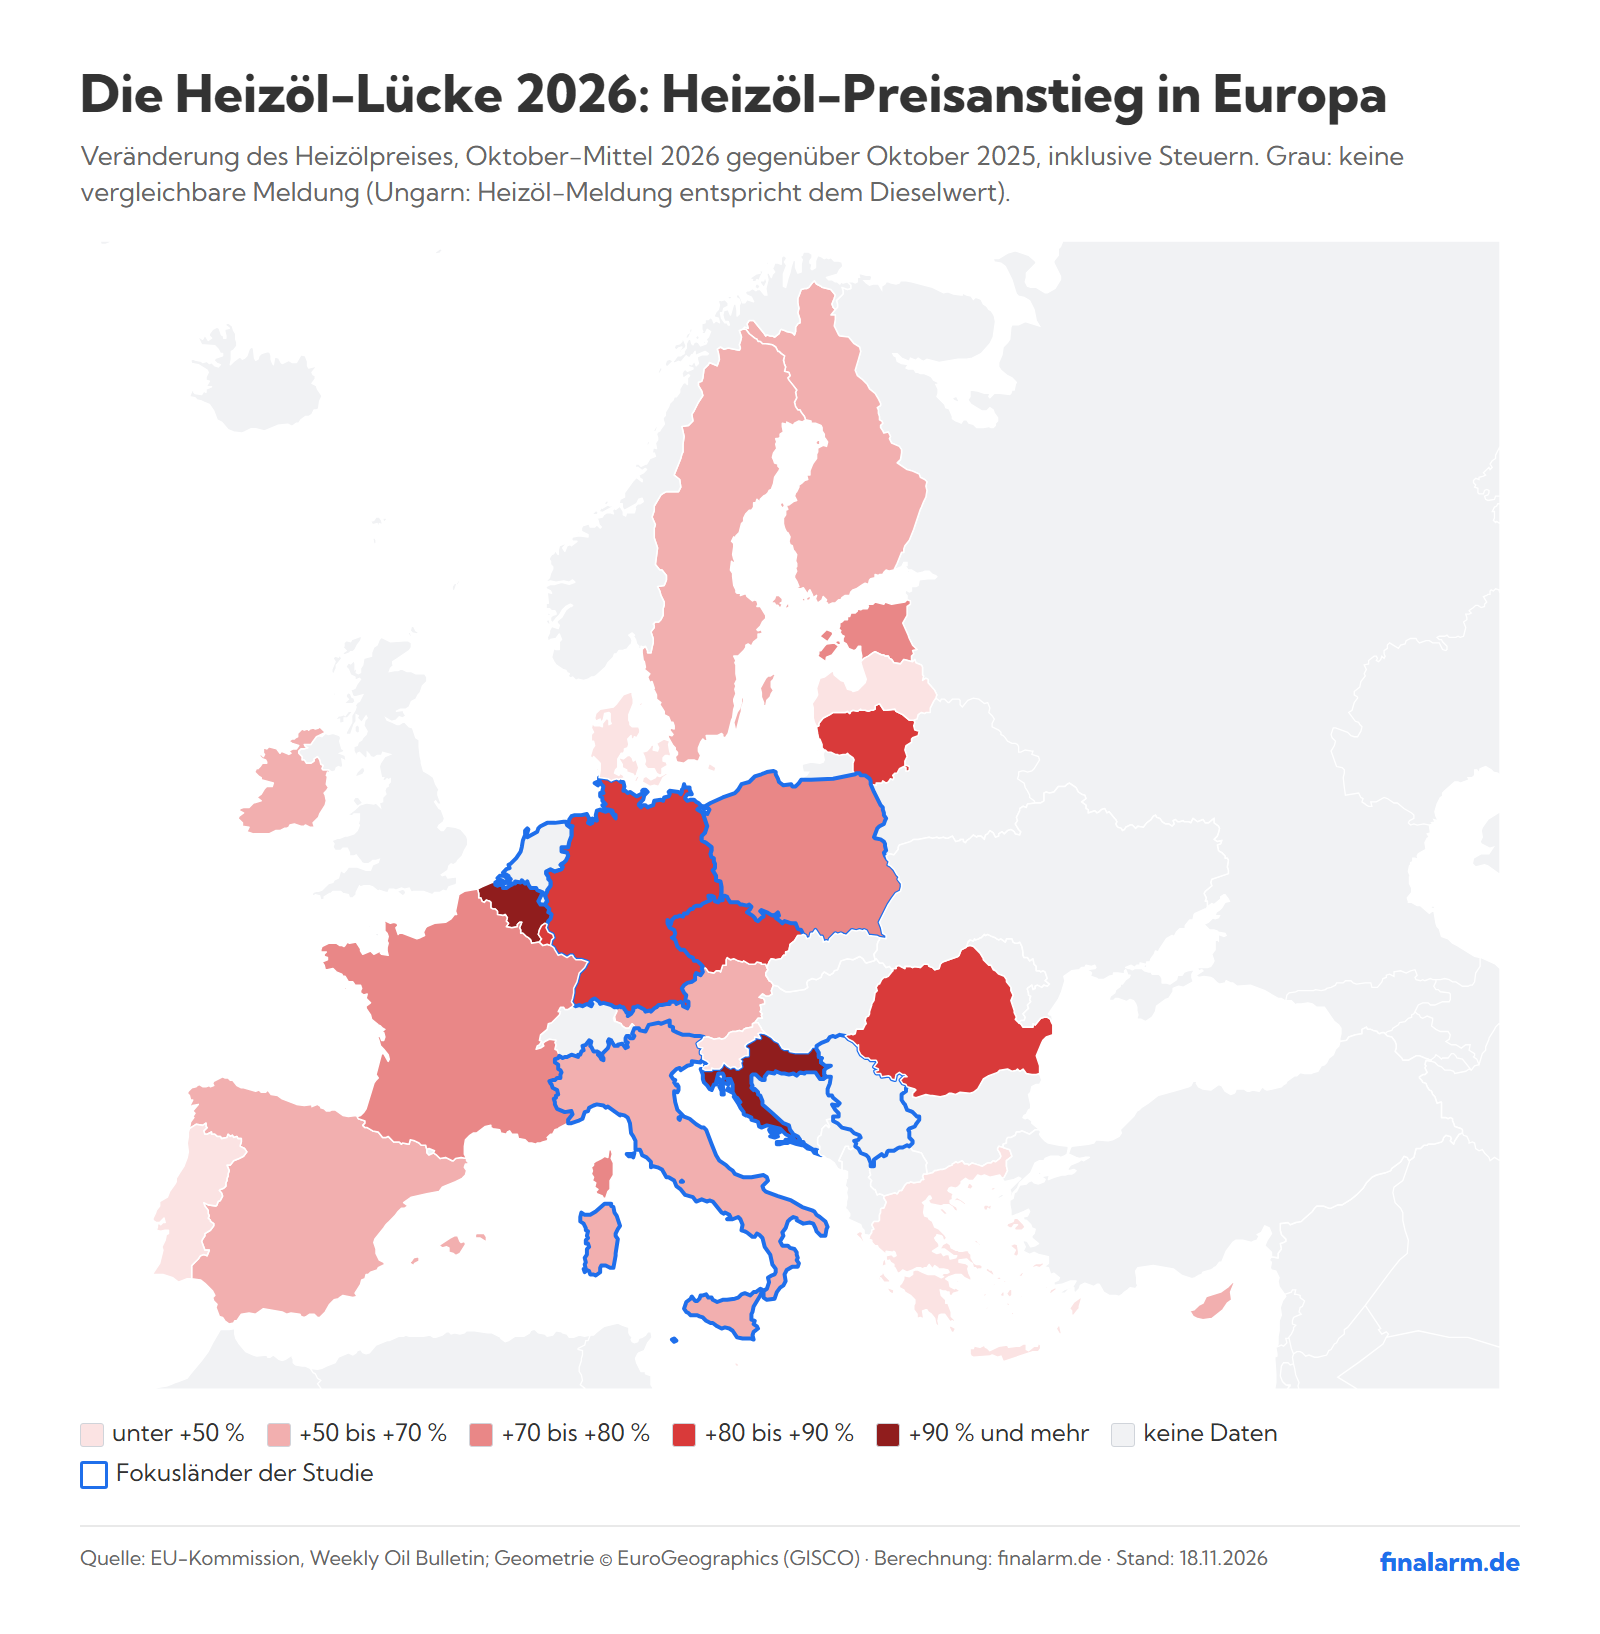
- European ranking: Germany has the EU’s third-steepest rise in heating-oil prices, behind Belgium and Croatia.
- Electricity check: Germany ranks 8th in the EU for environmental taxes on electricity, but 2nd for the electricity price.
Chapter 1 · The sore point
Almost everyone gets relief, yet oil-heated homes are around €330 short
In brief
- Oil-heated homes are just under €28 a month short, in all 400 districts.
- The average household is worse off in only 77 of 400 districts.
- €553 extra for heating oil against €219 in relief.
Motorists get two fuel tax cuts in 2026, electricity customers pay lower grid fees and, in 2027, less electricity tax. People who heat with oil get no relief of their own, even though heating oil cost 39.6% more from January to September and as much as 86% more in October. The bottom line: an oil-heated home is left around €330 a year short, just under €28 a month.
Across all households the sums add up almost everywhere: only 77 of 400 districts end up in the red. For oil-heated homes they add up in not a single district. Chapter 2 shows this oil-heating gap for every district; the Hardship Index in Chapter 3 also takes income and the share of oil heating into account.
Heating oil costs an oil-heated home €553 more than in 2025
According to the Federal Statistical Office (Destatis), heating oil was 39.6% more expensive from January to September 2026 than a year earlier. In our model an oil-heated home uses just under 1,480 litres a year, which adds up to €553 extra. We deliberately use these official prices, not the expensive October figures.
Four relief measures bring €219, none of them aimed at heating oil
Oil heating is most common where people drive a lot. Weighted by oil-heated homes, the relief is therefore slightly higher than the national average.
| Relief measure | Period | per household | per oil-heated home (weighted) |
|---|---|---|---|
| Fuel tax cut I | May/June 2026 | €21.08 | €24 |
| Fuel tax cut II | Oct. to Dec. 2026 | €27.41 | €32 |
| Grid-fee subsidy | 2026 | €80.51 | €83 |
| Electricity tax cut (agreed, not yet law) | 2027 | €78.50 | €81 |
| Total | 2026/27 | €207.50 | €219 |
€553 in extra costs against €219 in relief: oil-heated homes pay roughly two and a half times as much extra as they get back. The ratio is lowest in the Erzgebirgskreis (2.08 times) and highest in the Landkreis Kaiserslautern (3.02 times). In no district does the relief cover even half.
How we got there: €553 extra cost − €219 relief = €334 a year, rounded to around €330. Step-by-step calculation
Oil-heated households are about €330 a year worse off, just under €28 a month.
At official prices: from January to September 2026, heating oil cost on average €0.37/l more than a year earlier.
Heating-oil price: Destatis 61241-11, average Jan–Sep 2026 minus Jan–Sep 2025, +€0.37/l incl. VAT. Basis of comparison: extra cost of an oil-heated home vs relief for a household in the same district, both per oil-heated home (weighted), i.e. weighted by the number of oil-heated homes in each district. “Median district” = median of the 400 districts. Individual values rounded, hence a €1 rounding difference to the total. Electricity tax cut 2027: agreed, not yet law. Not included: the heating-cost component of housing benefit (Wohngeld; only households receiving it), the abolition of the gas storage levy (only gas customers).
As of: 18 November 2026
📌 Good to know
Basis of comparison: We set the extra cost for an oil-heated home against the relief for an average household in the same district. The periods differ: heating oil counts for one year, the two fuel tax cuts for five months together, grid fees for 2026 and the electricity tax cut for 2027. Not included are the heating-cost component of housing benefit (Wohngeld), the abolished gas storage levy and the planned fuel price cap.
And what about people who drive a lot and benefit twice from the fuel tax cut? Do they come out ahead? We worked through the most favourable case.
The stress test
Stress test: even with two cars, every district stays in the red
In brief
- A family with two cars gets both fuel tax cuts twice.
- Even then, with oil heating it is worse off in all 400 districts.
A household of three or more people gets both fuel tax cuts twice and saves €125.56 in electricity tax and €128.78 in grid fees. Even then it is worse off in all 400 districts. In the median district the extra cost for an oil-heated home is 1.58 times the relief, ranging from 1.07 in Rostock (Stadt) to 2.01 in the Landkreis Kaiserslautern.
What the study does not cover, such as heating systems replaced since the 2022 census or gas and district heating costs, is set out in the Method section.
But how big the gap is depends on where you live.
Chapter 2 · Your district
District check: how much you are short with oil heating, €198 to almost €465
In brief
- Depending on the district, the oil-heating gap ranges from €198 to almost €465 a year.
- It is largest in the Landkreis Kaiserslautern and smallest in Rostock (Stadt).
- The search shows you the figure for your district, per year and per month.
The oil-heating gap is what an oil-heated household is left short once everything is added up. It is largest where homes are big and use a lot of oil. Type your district into the search and you will see your figure straight away.
Oil-heated homes are worse off in all 400 districts: this is how much you are short
Oil-heated homes lose out in all 400 districts, most of all in the Landkreis Kaiserslautern at almost €465 a year.
Bottom line: extra heating-oil cost minus the 2026/27 relief measures (fuel tax cuts I + II, grid-fee subsidy 2026, electricity tax cut 2027, agreed but not yet law).
How many oil-heated households are affected depends on the share of homes heated with oil:
- from 0.41% in Rostock (Stadt) to 56.1% in the Landkreis Trier-Saarburg,
- in 52 districts at least 40% of homes heat with oil,
- in the median district it is just over 19%.
The extra cost per oil-heated home ranges from just over €360 to just over €700, depending on the floor space of homes in the district.
In the Hardship Index, which also counts income and the share of oil heating, a district in Saarland comes top.
Chapter 3 · The hardest hit
Hardship Index: Merzig-Wadern comes top, Rhineland-Palatinate has 8 of the top 20
In brief
- The Hardship Index combines the gap, the share of oil heating and income in each district.
- Number 1 is the Landkreis Merzig-Wadern in Saarland.
- Rhineland-Palatinate accounts for 8 of the 20 districts, Bavaria for 7.
The heating-oil gap hits the Landkreis Merzig-Wadern hardest. Next come the rural districts of Bernkastel-Wittlich, Trier-Saarburg and Birkenfeld in Rhineland-Palatinate and the Vogelsbergkreis in Hesse.
| Rank | District | Federal state | Share of homes heated with oil | Extra cost per oil-heated home | Relief per household | Oil-heated homes short per year | Average household: bottom line |
|---|---|---|---|---|---|---|---|
| 1 | Landkreis Merzig-Wadern | Saarland | 49.2% | €669 | €235 | €434 worse off | €115 worse off |
| 2 | Landkreis Bernkastel-Wittlich | Rhineland-Palatinate | 54.3% | €634 | €231 | €402 worse off | €160 worse off |
| 3 | Landkreis Trier-Saarburg | Rhineland-Palatinate | 56.1% | €659 | €227 | €432 worse off | €178 worse off |
| 4 | Landkreis Birkenfeld | Rhineland-Palatinate | 51.8% | €612 | €219 | €394 worse off | €134 worse off |
| 5 | Vogelsbergkreis | Hesse | 54.0% | €647 | €237 | €410 worse off | €148 worse off |
| 6 | Landkreis St. Wendel | Saarland | 50.6% | €662 | €228 | €434 worse off | €132 worse off |
| 7 | Landkreis Cochem-Zell | Rhineland-Palatinate | 50.0% | €640 | €234 | €405 worse off | €135 worse off |
| 8 | Eifelkreis Bitburg-Prüm | Rhineland-Palatinate | 49.6% | €658 | €236 | €421 worse off | €138 worse off |
| 9 | Landkreis Südwestpfalz | Rhineland-Palatinate | 49.2% | €665 | €236 | €429 worse off | €134 worse off |
| 10 | Landkreis Freyung-Grafenau | Bavaria | 46.8% | €646 | €241 | €405 worse off | €103 worse off |
| 11 | Landkreis Forchheim | Bavaria | 53.2% | €620 | €237 | €383 worse off | €119 worse off |
| 12 | Schwalm-Eder-Kreis | Hesse | 47.2% | €621 | €232 | €389 worse off | €85 worse off |
| 13 | Landkreis Straubing-Bogen | Bavaria | 48.5% | €703 | €259 | €444 worse off | €108 worse off |
| 14 (shared) | Zollernalbkreis | Baden-Württemberg | 50.8% | €601 | €232 | €368 worse off | €96 worse off |
| 14 (shared) | Landkreis Neustadt a.d.Waldnaab | Bavaria | 47.0% | €627 | €243 | €384 worse off | €83 worse off |
| 16 | Landkreis Amberg-Sulzbach | Bavaria | 46.6% | €628 | €240 | €388 worse off | €82 worse off |
| 17 | Landkreis Kusel | Rhineland-Palatinate | 39.6% | €672 | €233 | €439 worse off | €73 worse off |
| 18 | Landkreis Vulkaneifel | Rhineland-Palatinate | 42.9% | €632 | €230 | €401 worse off | €84 worse off |
| 19 | Landkreis Regen | Bavaria | 44.1% | €608 | €234 | €374 worse off | €72 worse off |
| 20 | Landkreis Cham | Bavaria | 44.9% | €647 | €245 | €402 worse off | €81 worse off |
The Hardship Index, on a scale of 0 to 100 points, weights:
- at 60%, what the average household is left short, measured against income,
- at 20%, the share of homes heated with oil,
- at 20%, the district's low income.
Merzig-Wadern scores 92.9 points: at €23,194 per resident, the district has the fourth-lowest disposable income of all 400 districts, and almost every second home heats with oil. The largest shortfall for the average household is in the Landkreis Trier-Saarburg at €178; it ranks 3rd.
The Landkreis Kaiserslautern, which has the largest oil-heating gap, ranks only 114th in the Hardship Index. Only 23.3% of homes there heat with oil, and the average household is even €35 better off. At the other end, Frankfurt (Oder) and Flensburg share rank 399; all 400 districts are in the Downloads.
Notably, not one large city is among the 20 hardest-hit districts.
Chapter 4 · Country versus city
Country versus city: around €350 short against just under €250
In brief
- Oil-heated homes are just under €250 short in large cities and around €350 in rural areas.
- Rural areas actually receive more relief: €220 instead of €179 per household.
- The average household is better off in all 16 federal states.
The gap for oil-heated homes exists in every district type defined by the Federal Institute for Research on Building, Urban Affairs and Spatial Development (BBSR). The average household across all heating types is different: on average it is better off in every district type.
| District type | Oil-heated homes short per year | Average household: bottom line |
|---|---|---|
| District-free large cities | €250 worse off | €141 better off |
| Urban districts | €342 worse off | €78 better off |
| Rural districts with signs of densification | €353 worse off | €73 better off |
| Sparsely populated rural districts | €352 worse off | €70 better off |
Oil-heated households are short about €350 in the countryside, just under €250 in big cities
In the countryside, people who heat with oil are short almost €352 a year, in big cities almost €250. The gap is everywhere.
By settlement-structure district type of the Federal Institute for Research on Building, Urban Affairs and Spatial Development (BBSR), for an oil-heated home (weighted by oil-heated homes) and for the average household across all heating types. Relief 2026/27 = fuel tax cut I (Tankrabatt, May–June 2026) + fuel tax cut II (October–December 2026) + grid-fee subsidy 2026 + electricity tax cut 2027 (agreed, not yet law).
Rural areas actually receive more relief: €220 per household, against €179 in large cities. Yet rural areas come out worse, because far more homes there heat with oil. Per 100 households there are just under 9 oil-heated homes in large cities and almost 26 in sparsely populated rural areas.
Three times as much fuel tax relief as in Berlin, yet a bigger shortfall
Together, the two fuel tax cuts bring a household in a sparsely populated district around €60, in Berlin just under €20. The Landkreis Straubing-Bogen gets the most, at €79 per household.
In all 16 federal states oil-heated homes lose out, the average household does not
At official prices the average household is better off in all 16 federal states, most clearly in Brandenburg at €158. In the east the figure is €139, in the west €85.
People who heat with oil are worse off in all 16 federal states, most of all in Rhineland-Palatinate
Oil-heated households in Rhineland-Palatinate are hit hardest: almost €389 a year. Berlin is least affected, but even there they are left almost €234 worse off.
What is left at the end: extra heating-oil cost minus relief 2026/27, for an oil-heated home (state average, weighted by oil-heated homes) and for the average household across all heating types. Relief 2026/27 = fuel tax cut I (Tankrabatt, May–June 2026) + fuel tax cut II (October–December 2026) + grid-fee subsidy 2026 + electricity tax cut 2027 (agreed, not yet law).
The reason is on the heating-oil bill: 1,000 litres cost €1,703.85 in October, against €914.88 a year earlier.
Chapter 5 · The cause
In October heating oil rose more than six times as fast as energy
In brief
- Heating oil cost 86% more in October than a year earlier (Destatis: +84.5%).
- Energy overall rose only 12.7%; electricity and natural gas actually got cheaper.
- The state profits too: just over €710 million in extra VAT.
According to the EU Weekly Oil Bulletin, heating oil cost 86% more in October 2026 than a year earlier; the Federal Statistical Office measures +84.5%. Energy overall became only 12.7% more expensive, so heating oil rose more than six times as fast.
This is how other energy sources moved in October, according to the Federal Statistical Office:
- Motor fuels, despite the fuel tax cut: +28.9%
- Firewood and pellets: +14.5%
- Electricity: 5.2% cheaper
- Natural gas: 1.2% cheaper
The highest weekly price of 2026 came in the week of 26 October: €1,750.10 per 1,000 litres, 92.7% more than in the same week a year earlier (€908.40).
Early November: heating oil still 75% dearer than a year ago
In the week of 9 November 2026, heating oil cost €1,690.90 per 1,000 litres, 75% more than a year earlier. The October average was up 86.2%.
Euros per 1,000 litres including taxes; dashed line: price in the same week a year earlier.
According to the 2022 census, 8.1 million homes heat with oil, almost one in five (18.8%). In the west there are 22 oil-heated homes per 100 households, in the east 11.
The state profits too: just over €710 million in extra VAT
Scaled up to all 8.1 million oil-heated homes, the extra cost comes to €4.47 billion, or €9.45 billion if October prices hold. By our calculation, the VAT on that alone brings the Treasury just over €710 million extra, around €1.5 billion in the October case. This is not a full account of tax revenue, only the VAT on the heating-oil price rise.
Politicians have responded, but at the petrol pump and on electricity.
Chapter 6 · The politics
Two fuel tax cuts for motorists, no help of its own for heating oil
In brief
- In 2026 motorists get a tax cut of 14.04 cents per litre, twice.
- Electricity customers pay lower grid fees in 2026 and less electricity tax in 2027.
- There is no relief of its own for heating oil (as of 18 November 2026).
Fuel tax cut II: just under 40% reaches private households
Twice the energy tax on petrol and diesel fell by 14.04 cents per litre, in May and June and from October to December 2026. Of the €2.78 billion in lost revenue from fuel tax cut II, including VAT, around €1.1 billion reaches private households in our model, just under 40%. The rest goes to businesses and lorries or is not passed on.
Grid-fee subsidy: around €80 for the average household
A federal subsidy cuts grid fees in 2026 by an average of around 2 cents per kilowatt hour. An average household using 3,383 kilowatt hours saves around €80.50 a year as a result.
Electricity tax: permanent cut for industry, one year for households for now
- Households today: 2.05 cents per kilowatt hour
- Manufacturing, agriculture and forestry since 1 January 2026: effectively 0.05 cents on application, with no end date, one forty-first of the household rate
- Households in 2027: 0.1 cents, agreed by the coalition committee overnight into 18 November 2026, not yet law
Even after the cut, households pay twice as much electricity tax as industry. On average a household saves €78.50 a year, just over €6.50 a month.
| Household | Electricity use per year | Saving per year, 2027 | Saving per month |
|---|---|---|---|
| 1 person | 2,105 kWh | €48.85 | €4.07 |
| 2 people | 3,470 kWh | €80.52 | €6.71 |
| 3 or more people | 5,411 kWh | €125.56 | €10.46 |
| Average of all households | 3,383 kWh | €78.50 | €6.54 |
Details and sources on the relief measures
- Fuel tax cut I (Tankrabatt I): 1 May to 30 June 2026, 14.04 cents per litre (Bundestag document BT-Drs. 21/5321), cost €1.45 billion. According to the Federal Cartel Office (Bundeskartellamt), 77.8% reached the pump for Super E5 petrol and 82.6% for diesel.
- Fuel tax cut II (Tankrabatt II): 1 October to 31 December 2026, 14.04 cents, up to 16.71 cents per litre including VAT, €2.485 billion in energy tax (BT-Drs. 21/8157). Pass-through according to the Federal Cartel Office (provisional trend) around 90% for diesel and around 60% for petrol; according to the German Institute for Economic Research (DIW Berlin) around 67% for diesel and 61 to 64% for petrol.
- Fuel price cap (Spritpreisdeckel): planned from 1 January 2027 (Federal Government, press release 171), not yet law.
- Grid-fee subsidy: €6.5 billion for the transmission grids in 2026 (BT-Drs. 21/8236); for 2027 to 2029 a draft law provides €5.525 billion a year.
- Electricity tax: industry under Section 9b of the Electricity Tax Act (Stromsteuergesetz), with a €250 deductible. Decision for households according to dpa, Reuters and ZDF. A permanent cut is intended according to dpa, but depends on funding being found in the 2028 budget. Cost according to press reports around €5 to €5.4 billion a year. The EU directive sets minimum rates of €0.5 per megawatt hour for business use and €1.0 for non-business use.
📌 Good to know
Status of decisions on 18 November 2026: Fuel tax cuts I and II and the 2026 grid-fee subsidy are law; the subsidy for 2027 to 2029 is a draft law. The electricity tax cut has been agreed for 2027 but is not yet law; according to dpa, the final vote on the 2027 budget is scheduled for 27 November. The fuel price cap is planned from 1 January 2027, and the housing benefit reform is a draft law.
And so far we have been calculating with the favourable case. October was considerably more expensive.
Chapter 7 · What could come next
If October prices hold, oil-heated homes are almost €950 a year short
In brief
- That would be almost three times as much as at official prices.
- The average household would also be worse off in 220 districts instead of 77.
- Under the draft, the heating-cost component of housing benefit is to be halved.
According to the EU Weekly Oil Bulletin, the October 2026 average price of heating oil was €0.789 per litre above the previous year. If that price holds for a whole year, an oil-heated home costs €1,167 more. The bottom line is then almost €950 a year short, almost three times as much as at official prices.
Average households would then also slip into the red in five federal states
If October prices hold, the average household across all heating types is worse off in 220 districts instead of 77, and in five federal states:
- Saarland: €178 (otherwise €29 better off)
- Bavaria: €171 (otherwise €33 better off)
- Rhineland-Palatinate: €149 (otherwise €45 better off)
- Baden-Württemberg: €129 (otherwise €54 better off)
- Hesse: €103 (otherwise €63 better off)
The west would fall to €56 in the red, while the east would stay €82 in the black (Berlin counts as east).
Housing benefit: for single people the heating-cost element is to fall from €96 to €48
Under the Federal Government's draft law (BT-Drs. 21/8284), the heating-cost component of housing benefit (Wohngeld) for a one-person household falls from €96 to €48 a month from 2027. The CO₂ component of €14.40 remains; in total the heating-cost relief falls from €110.40 to €62.40.
| Household | Heating-cost component today | under the draft, from 2027 | Cut (= half) |
|---|---|---|---|
| 1 person | €96 | €48 | €48 |
| 2 people | €124 | €62 | €62 |
| 3 people | €148 | €74 | €74 |
| 4 people | €172 | €86 | €86 |
| 5 people | €196 | €98 | €98 |
| each additional person | €24 | €12 | €12 |
Once fully in effect in 2029, around 381,000 households would drop out of housing benefit under the draft, about 143,000 of them moving to basic income support (Grundsicherung). Federal, state and local governments together save €1.156 billion in 2027. The Bundestag debated the draft at first reading on 8 October 2026; it has not yet been put to a vote.
Housing benefit is more common in the east: 41 in 1,000 households receive it, against 30 in the west. Anyone on housing benefit who heats with oil loses part of that support from 2027 under the draft.
Across the EU, heating oil rose even faster in only two countries.
Chapter 8 · European ranking
Heating-oil shock: Germany third in the EU, behind Belgium and Croatia
In brief
- Heating-oil price rise in October: Germany ranks 3rd of 23 EU countries with data.
- Oil in space heating: Germany ranks 7th in the EU, almost double the average.
- Cold homes: Germany ranks 14th in the EU, below the EU average.
Three rankings: price jump, oil share, cold homes. In the first two Germany is in the top 7. Only EU countries are counted: for heating oil the 23 that report to the EU Weekly Oil Bulletin, otherwise all 27. We list countries outside the EU separately.
Heating-oil shock: Belgium, Croatia and Germany in the top three
On the EU's heating-oil podium are Belgium (+101%), Croatia (+92.7%) and Germany (+86.2%): Germany ranks 3rd of 23
Heating oil: October 2026 average against October 2025
Only EU countries reporting to the Weekly Oil Bulletin (23 countries). Hungary not included: its heating-oil figure matches its diesel figure. No heating-oil figure: Bulgaria, Netherlands, Slovakia. Greece: two October reports each. Source: European Commission, Weekly Oil Bulletin (prices including taxes, October average of weekly figures)
On the October average, heating oil cost 101% more in Belgium than a year earlier, just under 93% more in Croatia and 86% more in Germany, against an EU average of 79.7%. Germany's price level, by contrast, is unremarkable: €1.69 per litre in the week of 9 November 2026, against an EU average of €1.67.
Belgium pays a heating-oil allowance from December, Germany does not
Several EU countries provide targeted help with heating oil or for low-income households. The table lists only measures with a government source or from the crisis tracker of the Bruegel research institute.
| Federal state | Measure | Period | Source |
|---|---|---|---|
| Belgium | Heating-oil allowance for low-income households in winter, rising with the price from a maximum of €0.20 to €0.50 per litre once heating oil costs €1.775 per litre | December 2026 to February 2027 | Bruegel tracker (research) |
| Luxembourg | State price support of €0.15 per litre of heating oil, plus €0.04 per kWh of electricity for households | extended to the end of 2027 | Bruegel tracker (research) |
| Ireland | Carbon tax on heating oil and gas for households cut from €63.50 to €48.50 per tonne | from October 2026 | Bruegel tracker (research) |
| Italy | An extra €115 a year on the electricity bill for 2.7 million vulnerable households, €315 in total | February to December 2026 | Government (Comunicato n. 162) |
| Austria | Social electricity tariff for low-income households, energy price 6 cents per kWh | since April 2026 | Federal Chancellery |
| Netherlands | Noodfonds Energie (energy emergency fund): refunds half of energy costs above 8 or 10% of income | January to May 2027 | Rijksoverheid (Dutch government) |
| Germany | No relief of its own for heating oil; fuel tax cuts I and II each lower the energy tax on motor fuel by 14.04 cents per litre | May/June and October to December 2026 | Bundestag |
Almost a quarter of space heating from oil: Germany ranks 7th in the EU
In Germany 24.6% of the energy households use for space heating comes from oil, against an EU average of 12.7% (Eurostat, 2024). Cyprus (62.9%), Ireland (56.6%) and Greece (43.4%) lead the table.
Cold homes: Germany below the EU average at 5.7%
5.7% of people in Germany cannot keep their home adequately warm, 2.4 percentage points more than in 2021. That puts Germany 14th in the EU; the EU average is 8.8%, and Greece (18.1%), Lithuania (16.7%) and Bulgaria (16.1%) top the list.
Outside the EU, some figures are much higher: Albania 33.6%, North Macedonia 27.0% (2024 survey), Türkiye 19.5%. In 2025, 31.9% of people in Greece were behind on electricity, gas or water bills, 7.3% in Croatia and 4.6% in Germany, and 17.3% in Serbia, which is outside the EU.
Only Croatia is ahead of Germany on heating oil: five countries in focus
Croatia: second in the EU for heating oil, just under 93% more expensive. Only in Belgium did heating oil rise faster in October. But Croatia uses little oil for heating: 3.9% of space heating (14th in the EU), and 4.2% of people cannot keep their home warm (19th in the EU, shared).
Poland: 8th for heating oil, 77.4% more expensive. Oil plays almost no role in heating, at 1.0% of space heating (20th in the EU). Cold homes are rare: 3.2%, 25th of 27 in the EU.
Italy: only 17th of 23 for heating oil, 50.0% more expensive. Oil supplies 5.9% of space heating (12th in the EU). But 8.6% of people cannot keep their home warm, 9th in the EU, just below the EU average of 8.8%.
Netherlands: hardly any oil heating, 0.8% of space heating. The Netherlands does not report a heating-oil price to the EU Weekly Oil Bulletin at all, and ranks 21st in the EU for oil share. 6.6% of people cannot keep their home warm, 12th in the EU.
Serbia: more cold homes than the EU average, at 9.3%. Serbia is not in the EU and does not report a heating-oil price to the EU Weekly Oil Bulletin; oil supplies only 1.0% of space heating. In 2025, 17.3% of people were behind on electricity, gas or water bills.
That leaves one claim often heard in the debate: that Germany has the highest electricity tax in the EU.
Chapter 9 · Electricity check
Highest electricity tax in the EU? No, 8th, but the electricity price ranks 2nd
In brief
- In 2025 Germany ranked 8th in the EU for environmental taxes on electricity.
- For the electricity price including taxes, Germany ranks 2nd.
- Minimum-wage workers in Romania work longest to pay their electricity bill, those in Luxembourg the shortest time (EU).
In Eurostat's "environmental taxes" component on household electricity, Germany ranked 8th in the EU in 2025 at 2.05 cents per kilowatt hour. Seven countries were higher, led by Denmark at 9.64 cents.
On the electricity price, however, Germany is near the top: 36.18 cents per kilowatt hour including taxes in the first half of 2026, against an EU average of 28.32 cents. Only in Ireland was electricity more expensive. Taxes and levies including VAT account for 12.30 cents in Germany, 34.0% of the price; only Poland is higher on this measure.
| Rank | Federal state | Environmental taxes on electricity 2025 per kWh | Electricity price incl. taxes H1 2026 per kWh |
|---|---|---|---|
| 1 | Denmark | 9.64 ct | 23.75 ct |
| 2 | Cyprus | 5.80 ct | 26.88 ct |
| 3 | Belgium | 4.94 ct | 35.75 ct |
| 4 | Poland | 4.51 ct | 29.99 ct |
| 5 | Sweden | 3.98 ct | 30.62 ct |
| 6 | France | 3.04 ct | 24.85 ct |
| 7 | Finland | 2.24 ct | 26.94 ct |
| 8 | Germany | 2.05 ct | 36.18 ct |
| – | EU-27 | 1.91 ct | 28.32 ct |
Electricity in working hours: longest in Romania, shortest in Luxembourg
To pay an annual electricity bill for 3,500 kilowatt hours, a full-time worker on the minimum wage has to work this long (electricity price first half of 2026, statutory hourly minimum wage on 1 January 2026):
- Romania: around 216 hours, more than in any other EU country with a statutory minimum wage
- Germany: just over 91 hours
- Luxembourg: 45 hours, less than in any other EU country with a statutory minimum wage
A year of electricity: about 216 hours on the minimum wage in Romania, about 91 in Germany
Minimum-wage workers in Romania work about 216 hours to pay for a year of electricity, the longest in the EU. In Germany it is about 91 hours.
Hours of work at the statutory minimum wage to pay an annual electricity bill for 3,500 kWh.
How we calculated
Method
In brief
- All 400 districts, official data from Destatis, the 2022 census, the Federal Motor Transport Authority (KBA) and Eurostat.
- Extra heating-oil cost for an oil-heated home minus the four relief measures for 2026/27 in the same district.
- In nine alternative calculations the oil-heated household stays in the red in all 400 districts.
For all 400 districts and district-free cities we set the extra heating-oil cost against the four relief measures for 2026/27, for an oil-heated household and for the average household. You can expand each step below and check it yourself with the Excel file.
Step-by-step calculation: from €553 to around €330
This is how the key figures are derived. The Germany column is the mean of all 400 districts, weighted by the number of oil-heated homes; the second column calculates the district with the highest Hardship Index. For every other district, the district check shows the same chain with that district's figures under "How it adds up for …".
| Step | Calculation | Germany | Merzig-Wadern |
|---|---|---|---|
| 1 Heating-oil price rise | (€110.646 − €79.253) per hectolitre ÷ 100 × 1.19 VAT, monthly averages January to September 2026 and 2025 | €0.3736/l | €0.3736/l |
| 2 Floor space per home | 2022 census, district figure | 101.4 m² | 122.7 m² |
| 3 Heating oil needed per year | Floor space × 117.8 kWh per m² × 1.239 (hot water) ÷ 10 kWh per litre | 1,479 l | 1,790 l |
| 4 Extra heating-oil cost per oil-heated home | Litres × €0.3736 | €552.55 | €668.74 |
| 5 Fuel tax cut I (May/June) | Fuel tax cut II × 61/92 days × pass-through May/June ÷ pass-through October | €24.22 | €28.61 |
| 6 Fuel tax cut II (Oct.–Dec.) | Cars per household × relief per car (Merzig-Wadern: 1.40 × €26.71) | €31.60 | €37.48 |
| 7 Electricity use per household | Destatis by household size, district figure | 3,471 kWh | 3,586 kWh |
| 8 Grid-fee subsidy 2026 | kWh × 2.0 ct × 1.19 | €82.60 | €85.36 |
| 9 Electricity tax cut 2027 | kWh × (2.05 − 0.1) ct × 1.19 · agreed, not yet law | €80.53 | €83.22 |
| 10 Total relief | 5 + 6 + 8 + 9 | €218.96 | €234.66 |
| 11 What oil-heated homes are short | 4 − 10 | €333.59 | €434.08 |
| 12 per month | 11 ÷ 12 | €27.80 | €36.17 |
| 13 Ratio | 4 ÷ 10 | 2.52 times | 2.85 times |
Row 11 becomes "around €330" in the text, row 12 "just under €28 a month" and row 13 "roughly two and a half times". All values are shown rounded and calculated with unrounded data, so totals may differ by one cent. The fuel tax relief per car is derived from mileage by district type, fuel consumption and pass-through at the pump; see the detailed formulas.
Scaling up: 8,095,061 oil-heated homes × the extra cost in their district = €4.47 billion (October scenario €9.45 billion). The VAT within that is 19/119 of it: €714 million (October €1.51 billion). Average household: extra cost of all oil-heated homes in the district ÷ all households in the district; in Merzig-Wadern €668.74 × 25,807 ÷ 49,426 = €349.17, minus €234.66 in relief leaves €114.51 in the red.
Which figure to quote? Mean, median and rounding
- €553, €219, €334: mean across all 8.1 million oil-heated homes, each home counted equally. Rounded in the text to "around €330".
- €329: median, i.e. the middle one of the 400 districts. Rounded, it also gives around €330.
- €207.50: relief for the average household across all 40.2 million households. It is lower than €219 because oil heating is concentrated where people drive more.
- 2.50 times: median of the 400 district ratios. Calculated from the means it is 552.55 ÷ 218.96 = 2.52. In the text: "roughly two and a half times".
- €198 to almost €465: lowest and highest district figures (city of Rostock, Landkreis Kaiserslautern).
- 77 districts: here even the average household across all heating types is worse off. If October prices hold, the figure is 220.
- Hardship Index: a ranking from 0 to 100, not a euro amount. The Landkreis Kaiserslautern has the largest euro amount, the Landkreis Merzig-Wadern the highest index score, because incomes there are also low.
- Electricity tax 2027: agreed, but not yet law. Without it, oil-heated homes are around €414 short.
Suggested wording: "In Germany an oil-heated home costs around €553 more in 2026 than in 2025. Fuel tax cuts, the grid-fee subsidy and the planned 2027 electricity tax cut bring around €219. That leaves oil-heated homes around €330 a year short, in all 400 districts. (Source: finalarm.de, study 'The Heating-Oil Gap 2026')"
All assumptions with sources
Every assumption that is not an official figure is marked as such. For the pass-through of the fuel tax cut and the tax status of the grid-fee subsidy we used the value that makes the relief larger. The sensitivity check shows how much the other assumptions move the result.
| Parameter | Value | Source | Type |
|---|---|---|---|
| Heating-oil price Jan.–Sep. | €110.65 (2026) and €79.25 (2025) per hectolitre, excluding VAT | Destatis 61241-11, delivery of 40–50 hl | official |
| Heating-oil price October | €1,703.85 (2026) and €914.88 (2025) per 1,000 litres, including taxes | EU Weekly Oil Bulletin, average of October weeks | official, scenario only |
| Oil-heated homes | 8,095,061 (18.8% of all homes), per district | 2022 census, table 4000W-1012 | official |
| Floor space per home | District figure, all homes | 2022 census | official |
| Space heating per m² | 117.8 kWh a year | German Environment Agency (Umweltbundesamt) based on Destatis environmental-economic accounts (UGR) and AGEB, 2024 figure, weather-adjusted | assumption |
| Hot water | +23.9% on top of space heating | AGEB energy use balance 2024: 99.0 TWh hot water against 414.1 TWh space heating | assumption |
| Calorific value of heating oil (EL) | 10 kWh per litre | DIN 51603-1: 42.6 MJ/kg × 0.845 kg/l ÷ 3.6, rounded | assumption |
| Fuel tax cut | 14.04 ct per litre, 16.71 ct including VAT | BT-Drs. 21/5321, 21/8157 | official |
| Pass-through, fuel tax cut I | Super E5 77.8%, diesel 82.6% | Federal Cartel Office, quarterly report 2/2026 | official (measured) |
| Pass-through, fuel tax cut II | Petrol 60%, diesel 90% | Federal Cartel Office, 4 November 2026; DIW Berlin: diesel around 67% | assumption, in favour of the relief |
| Cars per household | District figure, private owners, by fuel type | Federal Motor Transport Authority (KBA), vehicle stock 1 January 2026 | official |
| Mileage | 12,596 to 14,342 km per car per year, by district type | Mobility in Germany 2023 (MiD), calibrated to Destatis UGR 2024 | assumption |
| Fuel consumption | Petrol 7.8, diesel 7.3 litres per 100 km | Destatis UGR, cars of residents 2024 | official |
| Grid-fee cut | 2.0 ct per kWh, treated as a net amount (+19%) | BT-Drs. 21/8236: "by an average of around 2 cents" | official, tax status assumed |
| Electricity tax | 2.05 ct per kWh today, 0.1 ct in 2027 | Electricity Tax Act (StromStG) § 3; coalition decision 17/18 November 2026 | agreed, not yet law |
| Electricity use | 2,105 / 3,470 / 5,411 kWh for 1 / 2 / 3+ people, average 3,383 kWh | Destatis UGR 2021, interpolated by persons per household (INKAR) | official, district figure modelled |
| Disposable income | per resident and district, 2024 | Regional accounts of the federal states (VGR der Länder), series 2 volume 3 | official |
Sensitivity check: how robust is the result?
We changed each important assumption on its own and finally set all of them in favour of the relief at once. The result does not flip in any variant: an oil-heated household stays in the red in all 400 districts. Even in the most favourable case, with low heating demand, no hot water from the oil boiler and fuel tax cuts passed on in full, the average shortfall is still around €198.
| Variant | Extra cost per oil-heated home | Relief measure | Shortfall (mean) | Lowest district figure | Districts in the red |
|---|---|---|---|---|---|
| Baseline | €553 | €219 | €334 | €198 | 400 of 400 |
| Low space-heating demand (115.6 kWh/m², UBA figure 2023) | €542 | €219 | €323 | €192 | 400 of 400 |
| High space-heating demand (132.5 kWh/m², mean 2008–2022) | €622 | €219 | €403 | €244 | 400 of 400 |
| Hot water not from the oil boiler | €446 | €219 | €227 | €129 | 400 of 400 |
| Fuel tax cuts passed on 100% | €553 | €240 | €313 | €188 | 400 of 400 |
| Grid-fee subsidy 2 ct incl. VAT | €553 | €206 | €347 | €210 | 400 of 400 |
| Without the 2027 electricity tax cut | €553 | €138 | €414 | €266 | 400 of 400 |
| All assumptions in favour of the relief | €438 | €240 | €198 | €113 | 400 of 400 |
| October scenario (€0.789/l) | €1,167 | €219 | €948 | €600 | 400 of 400 |
Mean weighted by oil-heated homes. The values are also in the "Gegenrechnung" (sensitivity check) sheet of the Excel file. The household of three or more people with two cars is calculated as a separate stress test.
Formulas in detail
Extra heating-oil cost
Price rise: for light heating oil (delivery of 40 to 50 hectolitres) the Federal Statistical Office reports an average of €110.65 per hectolitre excluding VAT for January to September 2026, against €79.25 in the same period of 2025, i.e. 39.6% more.
Extra cost per oil-heated home = floor space per home in the district × 117.8 kWh per square metre × 1.239 (hot-water supplement) ÷ 10 kWh per litre × price rise per litre. Baseline scenario: €0.3736 per litre (Destatis 61241-11, mean January to September 2026 minus mean January to September 2025, × 1.19 for VAT). October scenario: €0.789 per litre (EU Weekly Oil Bulletin, October 2026 average minus October 2025 average). Extra cost per household = extra cost of all oil-heated homes in the district ÷ all households in the district.
Fuel tax cuts I and II
Fuel tax cut II per household = private cars per household × kilometres per car by fuel type and district type × consumption (petrol 7.8, diesel 7.3 litres per 100 km) × 16.71 cents per litre × pass-through (petrol 60%, diesel 90%) × 92 of 365 days. Fuel tax cut I = fuel tax cut II × 61/92 days, adjusted for the higher pass-through in May and June (Super E5 77.8%, diesel 82.6%) according to the share of diesel cars in the district.
Grid-fee subsidy 2026 and electricity tax cut 2027
Grid fee = electricity use × 2.0 cents per kWh × 1.19 (BT-Drs. 21/8236: "by an average of around 2 cents per kilowatt hour"). Assumption: the document gives no tax status, so we treat the 2 cents as a net amount and add 19% VAT. Electricity tax = electricity use × (2.05 − 0.1) cents per kWh × 1.19. Consumption by household size according to Destatis (2021): 1 person 2,105 kWh, 2 people 3,470 kWh, 3 or more people 5,411 kWh. For each district we interpolate by persons per household and calibrate to the national average of 3,383 kWh. Full pass-through by suppliers is assumed.
Balance and ratio
Balance for an oil-heated household ("what oil-heated homes are short") = extra cost per oil-heated home − relief per household in the district; weighted by oil-heated homes, the mean is €334, the median across districts €329 and the October scenario €948. Balance for the average household = extra heating-oil cost per household − relief per household. Ratio = extra cost per oil-heated home ÷ relief for an average household in the same district, median 2.50, October scenario 5.29.
Hardship Index
The Hardship Index (0 to 100) combines three measures, each scaled from 0 to 100 across the 400 districts: (value − lowest value) ÷ (highest value − lowest value) × 100. Index = 0.6 × balance of the average household as a percentage of its disposable income + 0.2 × share of homes heated with oil + 0.2 × low income (disposable income per resident, scaled in reverse). Rank 1 = largest gap; equal values share a rank. The weights are an editorial choice. The index ranks the districts; the euro amounts in the text never come from the index.
Data sources, boundaries and Europe
Data sources
Oil-heated homes: 2022 census, table 4000W-1012 "Homes: energy source of heating", reference date 15 May 2022, all 400 districts. Households and floor space: 2022 census. Disposable income: regional accounts of the federal states, 2024. Cars: Federal Motor Transport Authority, stock on 1 January 2026. Mileage: Mobility in Germany 2023, calibrated to fuel consumption in the 2024 environmental-economic accounts. District types: BBSR. Housing benefit: regional database, as of 31 December 2025. Europe: Eurostat and EU Weekly Oil Bulletin.
Boundaries and special cases
Hanau has been a district-free city since 1 January 2026; as in the rest of the data, we have assigned it to the Main-Kinzig-Kreis. The city of Trier and the Landkreis Trier-Saarburg form a single registration district at the Federal Motor Transport Authority, so we split the cars by population.
Europe
Heating oil: EU Weekly Oil Bulletin, prices including taxes, average of the October weeks 2026 against 2025, 23 reporting countries, Hungary excluded. Oil share: Eurostat nrg_d_hhq, final energy consumption of households for space heating 2024. Electricity prices: Eurostat nrg_pc_204, consumption band 2,500 to 4,999 kWh. Minimum wage: Eurostat earn_mw_cur, as of 1 January 2026. We convert to an hourly wage using the same weekly hours Eurostat uses to derive the monthly figures (Germany 38.8, Ireland 39, France 35, Netherlands 36 hours), otherwise the statutory standard working week (Belgium 38, other countries 40 hours). This gives the statutory hourly rates, for example €13.90 in Germany and €12.02 in France. The hours comparison covers only EU countries with a statutory minimum wage. Energy poverty: Eurostat ilc_mdes01 and ilc_mdes07, 2025 survey. Rankings cover EU countries only, for heating oil the 23 reporting countries, otherwise all 27, sorted in descending order; equal values share a rank.
Limits of the study
- Heating stock: the oil share comes from the 2022 census. Heating systems replaced since then and empty homes are not taken into account.
- Time of purchase: anyone who filled their tank in spring paid a smaller premium. That is why we calculate with January to September and show October only as a scenario.
- Floor space: we use the average floor space of all homes in the district. Oil-heated homes are often in larger houses, so their extra cost is likely to be higher, if anything.
- Fuel tax cut: mileage from Mobility in Germany 2023, pass-through estimated.
- Electricity: consumption by household size from 2021. The grid-fee cut is a national average (around 2 cents per kilowatt hour), and the electricity tax cut is not yet law.
- Not considered: gas and district heating costs, the heating-cost component of housing benefit and the planned fuel price cap.
Review, versions and corrections
Two independent reviewers checked the calculation and the primary sources, two reviews checked the plan, and the finished text went through final checks. Corrections from these reviews have been incorporated, such as the corrected Destatis figure for energy overall (+12.7%), the addition of fuel tax cut I and the 2026 grid-fee subsidy.
Versions
- 18 November 2026: publication (German original).
- 19 November 2026: added the step-by-step calculation, the assumptions table, the sensitivity check and the calculation per district; Excel file extended with formula sheets. No figure in the study has changed.
- 19 November 2026, correction: in the "Electricity in working hours" comparison we had previously converted the monthly minimum wage to an hourly rate for all countries using a 40-hour week. Eurostat, however, derives the monthly figures for Germany, Ireland, France and the Netherlands from 38.8, 39, 35 and 36 hours a week. With the correct hourly rates the figure for Germany is just over 91 hours instead of almost 94, for France 72 instead of 83, for Ireland 96 instead of 98, for the Netherlands 58 instead of 65 and for Belgium (38-hour week) 97.5 instead of 103 hours. Romania remains the longest and Luxembourg the shortest. Non-EU countries are no longer in the hours comparison.
Any corrections after publication are listed here with their date.
Check it yourself: Excel with formulas
The Excel file for the study (German column headers) has three sheets for checking the figures:
- Annahmen (assumptions): all parameters in one column. If you change a value there, such as heating demand per m², the "Rechenweg" sheet recalculates all 400 districts.
- Rechenweg (calculation): the input values for each district and every calculation step as an Excel formula, through to the balance and ratio.
- Gegenrechnung (sensitivity check): the nine variants from the table above.
The district data is also available as a CSV file. Questions about the method are answered by the finalarm editorial team (contact details per imprint).
For newsrooms
For newsrooms: data, graphics, citation
In brief
- All 400 districts, 16 federal states and the European comparison as Excel and CSV.
- Free to use with a source credit and a link to the study.
The data for 400 districts, 16 federal states and the European comparison is available to download as Excel and CSV (German column headers), along with the infographic as a PDF and the maps as PNG files (in German).
Data and graphics to download
All the study's figures, to check and reuse. As of: 18 November 2026.
Citation: Source: finalarm.de, study “The Heating-Oil Gap 2026”, as of 18 November 2026, https://www.finalarm.de/studies/heating-oil-gap-2026/. Data and graphics may be used freely with credit and a link.
💡 Tip
How to cite: Source: finalarm.de, study "The Heating-Oil Gap 2026" (as of 18 November 2026), https://www.finalarm.de/studies/heating-oil-gap-2026/. You may use and embed the graphics and data with this credit and a link to the study.
The study is an independent analysis by finalarm.de, not commissioned by anyone, and contains no affiliate links. Press contact: finalarm editorial team, address per imprint. You can find more analyses in the finalarm studies section (in German).
Sources
- Federal Statistical Office: energy price data (table 61241-11, heating oil)
- Federal Statistical Office: consumer prices October 2026 (press release 392)
- 2022 census: homes by energy source of heating (table 4000W-1012)
- European Commission: Weekly Oil Bulletin
- Eurostat: electricity prices for household consumers (nrg_pc_204)
- Eurostat: electricity price components (nrg_pc_204_c)
- Eurostat: energy consumption in households by use (nrg_d_hhq)
- Eurostat: statutory minimum wages (earn_mw_cur)
- Eurostat: inability to keep home adequately warm (ilc_mdes01)
- Eurostat: arrears on utility bills (ilc_mdes07)
- Federal Motor Transport Authority: vehicle stock FZ1, 1 January 2026
- BBSR: spatial classifications, district types 2025
- Regional accounts of the federal states: disposable income of private households, districts
- Mobility in Germany 2023: results report
- German Environment Agency: final energy consumption for space heating, private households
- Destatis UGR: electricity consumption of private households by household size
- Regional database: housing benefit households by district (22311-01-02-4)
- German Bundestag: document 21/5321 (fuel tax cut I)
- German Bundestag: document 21/8157 (fuel tax cut II)
- Central Customs Authority (Generalzolldirektion): energy tax cut from 1 October 2026
- Federal Cartel Office: pass-through of the fuel tax cut in October 2026
- Federal Cartel Office: quarterly report of the Market Transparency Unit 2/2026
- DIW Berlin: pass-through of the fuel tax cut for petrol
- Federal Government: fuel price relief package (press release 171)
- Electricity Tax Act (Stromsteuergesetz) § 3
- Federal Law Gazette (BGBl.) 2025 I No. 340 (electricity tax for manufacturing)
- German Bundestag: document 21/2760 (EU minimum tax rates)
- German Bundestag: document 21/8236 (subsidy for transmission grid costs)
- German Bundestag: document 21/2469 (gas storage levy)
- German Bundestag: document 21/8284 (housing benefit reform)
- German Bundestag: text archive on the Housing Benefit Act
- Housing Benefit Act (Wohngeldgesetz) § 12
- Skatteforvaltningen: electricity tax cut in Denmark 2026 and 2027
- Bruegel: European energy crisis fiscal response tracker 2026
- Italian Government: Comunicato stampa n. 162
- Austrian Federal Chancellery: Council of Ministers paper 54/7
- Rijksoverheid: Kabinet maakt bijna een miljard vrij
- Press report (dpa via Tagesspiegel): coalition agrees electricity tax cut for 2027
- Press report (Reuters via Börsen-Zeitung): electricity tax cut for 2027
- Press report (ZDFheute): agreement on electricity tax and fuel price cap
Frequently asked questions
Is there any relief for heating oil in Germany in 2026?
No, there is no relief specifically for heating oil (as of 18 November 2026). Fuel tax cuts, the grid-fee subsidy and the electricity tax cut bring an oil-heated household around €219 on average, while heating oil costs it around €553 more at official prices. The bottom line is a shortfall of around €330 a year, and every one of the 400 districts is in the red.
How much does the 2027 electricity tax cut bring?
€78.50 a year on average. A single person saves €48.85, a household of three or more people €125.56. The cut from 2.05 to 0.1 cents per kilowatt hour applies only to 2027 and is not yet law.
How was the calculation done?
The extra cost comes from the consumption of an oil-heated home and the price rise of €0.3736 per litre according to the Federal Statistical Office (January to September 2026 against 2025). Against this we set the relief for an average household in the same district from fuel tax cut I, fuel tax cut II, the 2026 grid-fee subsidy and the 2027 electricity tax cut. Bottom line: €553 minus €219 gives €334, rounded to around €330. The Method section shows the step-by-step calculation.
Why are rural areas hit harder?
Far more homes in rural areas heat with oil: in sparsely populated districts there are almost 26 oil-heated homes per 100 households, in large cities just under 9. Rural oil-heated homes are around €350 a year short, those in large cities just under €250. If October prices hold, even the average household in sparsely populated rural areas slips €96 into the red.
Where in Europe has heating oil risen most?
In Belgium. On the October 2026 average, heating oil there cost 101% more than a year earlier. Croatia follows with just under 93% and Germany with 86%, which is 3rd of 23 EU countries with usable data in the EU Weekly Oil Bulletin.
May I use the data and graphics?
Yes. Credit "finalarm.de, study 'The Heating-Oil Gap 2026'" and link to the study. Data for all 400 districts is available as Excel and CSV in the section for newsrooms.